
Nigerian Treasury bills are bought at a discount and repay face value at maturity; conventional FGN bonds pay scheduled coupons and return principal at maturity. Compare the cash paid, payment dates and yield on a consistent basis. A bill’s quoted discount rate and a bond’s coupon are different measures, while selling either investment early changes the calculation.
Source check: 3 October 2026. Publisher: Naija Investing.
A Treasury-bill stop rate of 15.89% and an FGN bond yield of 16.85% look easy to compare. They are different quotations attached to different cash flows, however. Choosing between them requires knowing how much cash leaves the account, when money comes back and what happens if the investment must be sold early.
September’s official auction results provide a practical example. The CBN’s government-securities data records marginal rates of 15.50%, 15.80% and 15.89% for the 91-day, 182-day and 364-day Treasury bills auctioned on 23 September 2026. These are dated auction observations, not executable prices for 2 October.
The Treasury-bill return begins with the purchase price
The CBN describes Nigerian Treasury bills as short-term securities issued at a discount. An investor pays less than the face value and receives that face value at maturity. There is no separate stream of semi-annual coupons.
Consider an illustrative ₦1 million face-value, 364-day bill using the September auction’s 15.89% discount rate. On an assumed 365-day calculation basis, the discount is ₦158,464.66: face value multiplied by 15.89%, multiplied by 364/365. The purchase price is therefore approximately ₦841,535.34, before fees or any applicable deductions.
The investor’s gain of ₦158,464.66 is earned on the cash actually paid. Dividing it by ₦841,535.34 produces a holding-period return of about 18.83%. Simple annualisation gives approximately 18.88%. That annualised number is not a compounded return, and the worked example is not a dealer quotation.
This is why casually describing the discount rate as the investor’s return on cash invested can mislead. It also explains why an advertisement promising interest “upfront” needs careful reading: economically, the discount reduces the purchase cost. It is not an additional cash payment on top of that reduced cost and the maturity proceeds.
A bond’s coupon survives a change in its yield
At the 14 September 2026 FGN bond auction, the new September 2036 bond cleared at 16.79%. The reopened June 2038 bond cleared at 16.85%, while retaining its existing 15.45% coupon. The DMO explicitly distinguished the auction yield from that unchanged coupon.
For ₦1 million face value of the 15.45% bond, the contractual annual coupon is ₦154,500, or ₦77,250 each half-year. Those payments are based on face value. They do not become ₦168,500 merely because the auction yield was 16.85%.
The September offer circular specifies semi-annual interest and repayment of principal at maturity. For reopened bonds, buyers pay the price corresponding to the clearing yield, plus accrued interest. That makes the settlement amount essential to evaluating the investment.
Yield to maturity incorporates the price paid and the timing of scheduled coupons and principal. Realising an equivalent compounded return over the full life also depends on reinvesting coupons at the assumed yield. A coupon rate alone cannot settle a comparison with a discounted bill.
Does a higher bond yield increase the coupon payment?
No. For an existing fixed-rate bond, the coupon remains based on its fixed coupon rate and face value. The yield changes with the price and remaining payment schedule. Check accrued interest and charges as well as the quoted yield before comparing the bond with a Treasury bill.
| Instrument | Cash received if held to maturity | Rate to read carefully |
|---|---|---|
| Treasury bill | Face value at maturity; the discount reduces the purchase price | Discount rate is based on face value, not the cash invested |
| Conventional fixed-rate FGN bond | Scheduled coupons plus principal at maturity | Coupon determines contractual interest; yield also reflects price |
Sources: CBN FAQs: Nigerian Treasury bills; DMO September 2026 FGN bond offer circular. The notices and auction results discussed in this guide are dated examples, not current offers or open dividend entitlements.
The calendar may matter more than the headline rate
A bill maturing near a known spending date can reduce the need to sell an investment prematurely. A long bond can provide recurring cash payments and preserve a fixed coupon stream for years. It also exposes the holder to greater price sensitivity when market yields change, all else equal.
If yields rise, an existing fixed-rate bond’s market price normally falls. Holding to maturity avoids having to realise that price movement, provided the investor can wait and the issuer pays as promised. It does not eliminate inflation risk or the opportunity cost of earning an older rate.
Bills bring a different problem: reinvestment. A saver rolling over short maturities cannot assume that today’s return will remain available at the next auction. Conversely, shorter maturities allow money to be repriced sooner if yields increase. A ladder of different maturity dates can spread that timing exposure, although it requires attention to minimum dealing sizes and costs.
Before placing an order, ask for the security identifier, face value, actual settlement amount, maturity date, all charges and the dealer’s yield convention. For bonds, obtain the coupon schedule and accrued interest separately. Compare the resulting cash flows over the same intended holding period, using a common return convention. The higher-looking percentage is only the beginning of the decision.
If you are comparing direct government securities with a fund, our NIDF Series 12 analysis shows why an infrastructure-debt fund’s target return, credit exposure and exit terms require a separate assessment.
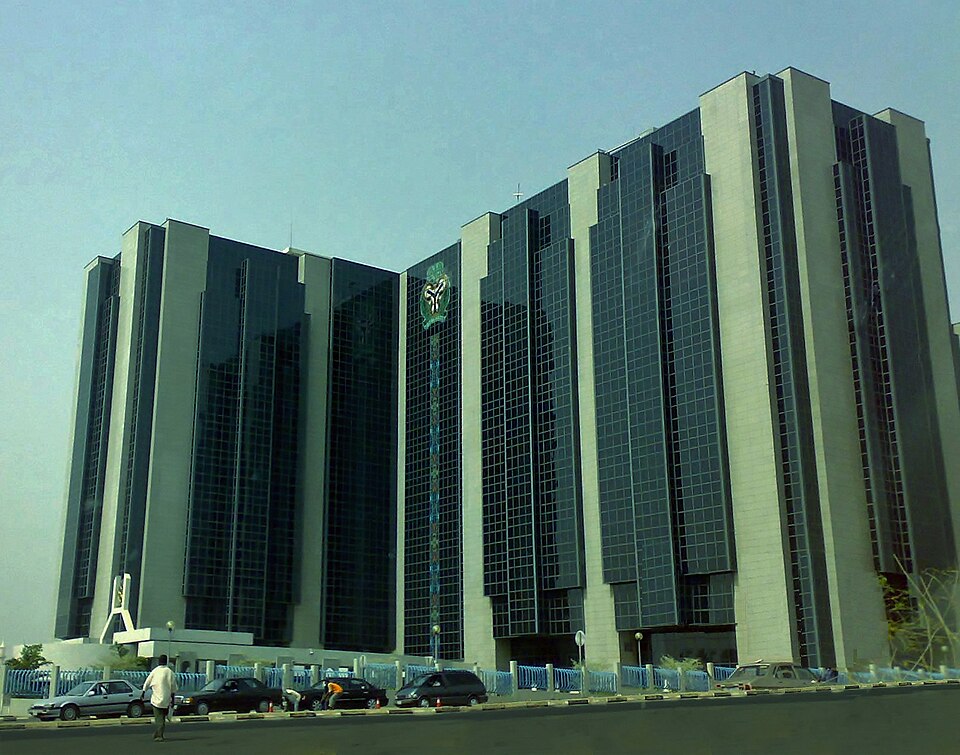
Image: Central Bank of Nigeria headquarters, Abuja. Archive photograph by chippla at English Wikipedia / Wikimedia Commons, released to the public domain. Commons version includes colour correction by Jamie Tubers. Wikimedia-provided 960px rendering; no local visual edits.

